TIP
TIP had a weak week, until Friday where is gapped up, closed the intraday gap and then rallied to end above the EMA lines. It tells of further rallying next week, which would put at least another two weeks of rally in place.
JNK
The coporate bonds on the weekly, if it is to equilibrate the bearish divergence appears to have much more to go in time period, but in price it appears to have gone the distance. Three of the past four weeks have resulted in long shadows which are indicating that there is a lot of buying power when prices fall. A number of indicators are also telling of building up underlying strength. The daily charts have a higher low in price and indicators and ended the week with a gap up. IF this is a runaway gap, we would be in for a rather huge rally.
/HG
Copper prices have not looked very well recently, but one can notice the long lower shadows in the recent weeks. A less convincing indicator bounce is suggested. In the daily charts, copper registered a higher low but for now, but the indication of a rally is less convincing – at least for now.
Napier’s indicators are aligning towards a downtrend reversal into a potential rally.
SPX/SPY (S&P500)
Last week’s call for a bullish week ended nicely with a long legged small body candle which looks like a spinning top. The coming week, ending bullishly would complete the morning star candle formation, which would be very bullish on a weekly chart. Note also the 3 of the past 4 weeks had long lower shadows on the weekly candles indicating a lot of bottom buying that follows market dips.
The weekly SPY charts looks as if there is more to equilibrate the bearish divergence, but indicators are starting to show a short term rally. This rally should not close above 1111, otherwise the rally would be continuing. Similarly, the daily charts have indicators that are showing short term bullish divergences. However, Friday ended with a matching high that closed down more than 50% of the previous candle… looks like Tuesday may close down, and if so, we are looking for a higher low (>1074) to form later in the week.
/DX
The USD futures weekly charts did go parabolic, and appears to have strength for another rally. However, a possible double top could be in the making, with bearish divergences forming on the daily charts along with falling open interest, although the rate of falling open interest is less this past week. Appears that there may be another spike, and then a correction should be in place.
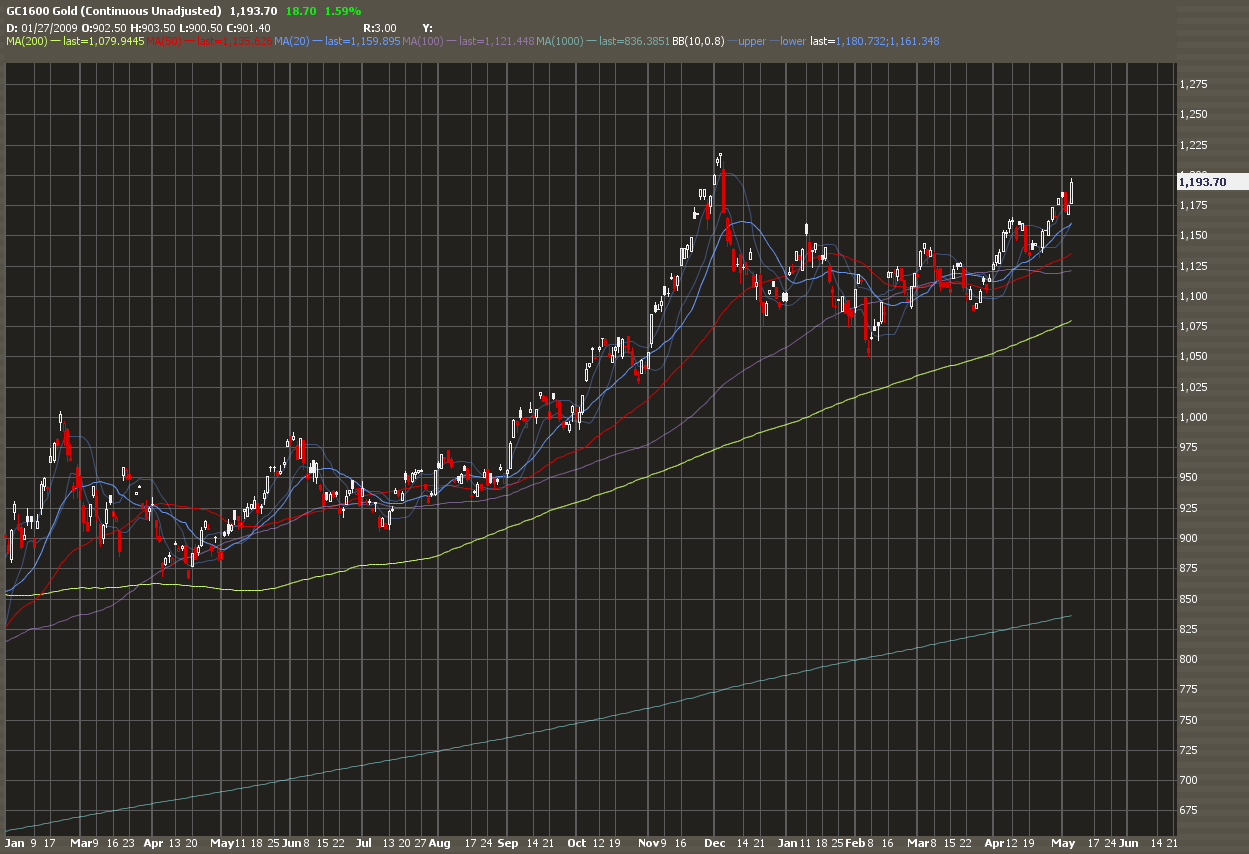
/GC
Weekly gold futures is building up a bearish divergence but a spike is indicated in the charts. The daily charts show the previous week’s correction in gold to the trendline having a fake breakdown and a small rally, with more to follow. Gold looks bullish for the short term.
/CL
Crude finally got a reprive from its rather extreme fall. Early in the week, a long dragonfly doji started a strong reversal to the upside. This should follow though above 75.80, otherwise a resumption of the downtrend would be in place. Let’s see what happens to this one…
VIX
The VIX has a bearish divergence forming… if it is to go down further, it would mean that the weekly bullish divergence completed. However, the daily chart containing the bearish divergence looks weak on the RSI, but possibly may spike higher in the coming 4 weeks. Watching the VIX breaking below or staying above 30 would be the key to the coming market direction.
SYNOPSIS
From last week’s WMA - “I am expecting a bullish week. Be it a minor bullish retracement or otherwise, there is one thing that would be clear… it would be volatile.”
Indeed it was so.
This coming rather short week (Monday is Memorial Day holiday) and the NFP on Friday, should put a great deal of volatility in the markets. The initial rally has been done, and with markets “near value” for the time being, it is getting difficult to make a good call. However, the leading indicators as well as underlying indicators are pointing to another bullish week.
Note: Any material posted here is of my sole opinion, and my opinion may differ from others. It is definitely NOT a solicitation to do anything else as a consequence of reading this material. The material presented here is intended for educational purposes only.
Monday, May 31, 2010
Thursday, May 27, 2010
Another Failed Bounce - Market Analysis for 27th May 2010 by Singaporeseeds
Daily charts for S&P

S&P did a nice upward move throughout the whole day only to fail in the last 2 hours. It closed below my lower MOBO band. This indicates that the downward momentum is still strong. The February lows of 1050 are still holding for now. As long as this low is not breached, a bounce is still possible.
As of now, overnight futures have rallied by over 20 points on the S&P. S&P has to close above 1080 soon otherwise we might be going through a few more days of weakness before a rally occurs. I still believe that the downtrend should end by Friday this week. Hence the market would have to close and hold above 1080 by end of the week.
Wednesday, May 26, 2010
And Here We Bounce – Market Analysis for 26th May 2010 by Singaporeseeds
Monthly charts for Dow

Weekly charts for Dow

Daily charts for Dow

On monthly charts, Dow did a bearish engulfing and is at MOBO lower band support now. Weekly it’s at the 50 SMA support (red line) and on daily it was a hammer candlestick pattern. On daily charts it had tanked too far out from the MOBO bands and I believe it would be rallying over the next few days to test the 10,250 resistance level.
Monthly charts for S&P

Weekly charts for S&P

Daily charts for S&P

On monthly charts, S&P is at the 200 SMA and lower MOBO band support. On weekly, it is also at the 50 SMA support level (red line) and Tuesday was a hammer candlestick pattern. This is very similar to the Dow and I believe it should be rallying to 1100 over the next few days. As the hammer candle stick pattern with a bullish confirmation on the next day indicates the start of a bullish trend, I will be monitoring the market movements tonight.
Monthly charts for NASDAQ

Weekly charts for NASDAQ

Daily charts for NASDAQ

NASDAQ had been the most bullish throughout this huge bull run from March 2009 and hence NASDAQ had corrected the most during this correction. However on monthly and weekly charts, NASDAQ is still above its 50 SMA. On a weekly and monthly basis, I believe it should bounce at this stage. Although there are 2 more days before the end of May, my charts are indicating that June 2010 would be a bullish month. We shall be able to know whether this bullish month will be a bear trap or the continuation of the March 2009 rally in the next few weeks to come.
Sunday, May 23, 2010
WMA 23rd May 2010 – for trading week ending 28th May 2010
In last week’s analysis, I posted “The overall activity of the market appears to show that the relief bounce is over. I am discounting that for now, preferring to observe. No doubt I still maintain that the market is likely to have topped out for a significant correction, perhaps not before an attempt to fail the top again.” Midweek, the markets confirmed a quick dive to the lows, failing the 50MA twice, and breaking support levels. Let’s see how it all ended and what to expect for the coming week…
TIP
During the week, the TIPS tanked to value and at the end of the week, rallied up again with candles that have long low tails. From the daily charts, it looks like a continuation rally is in the cards and should be revealed later this coming week.
JNK
The corporate junk bonds did equllibrate the bearish divergence with a bang like the overall markets. On the daily charts, it looks like it has some more to go. Weekly charts look much worse really… there is likely to be much more.
The daily charts are showing something interesting… that although mid last week there was a gap down commitment it appears to have reversed abruptly with a bullish engulfing and short term bullish divergence on my indicators. This bullishness should continue for 2-3 days till mid-week.
/HG
Copper started out the week bad, with prices falling and then it stalled, only for the week to end with prices rallying almost back to where the week started. This ended the week with a slightly deformed looking hammer. The daily charts show a short term bullish divergence.
This week, Napier’s leading indicators are realigning for a possible rally. The TIPS are about to continue the rally, JNK and copper ending the week with short term bullish divergences. It looks like that coming week would have a higher probability of being bullish.
/DX
The USD (futures) went parabolic mid-week and started correcting. This was indicated by the drop in open interest as large players were closing their positions on the USD rally. The weekly charts show that the resistance level at 86.35 held, and with the parabolic run-up, the USD should be correcting to about 84.
SPX
The SPX/SPY ended the previous week with a long legged hammer indicating a possible upside, and at that weekend, it looked as if the market was not yet committed. Once the week opened, by Tuesday, it was clear as daylight that the lows of the 6th of May would be tested. This was followed by a gap down on Thursday with Friday opening hours testing the lows of 6th May. Friday then closed to complete a piercing pattern. Although the weekly chart has indicated a significant correction, led off by a weekly bearish divergence, the weekly bearish divergence has not equilibrated, and should take weeks more to do so. However, the increase in volatility may have made up for it, and the daily charts now indicate that the coming week should be bullish. Friday’s piercing pattern is one such indication, and closing the gap by SPX breaking out over 1115 would confirm a short term rally is at hand. Other indicators also suggest that a short term reversal is in the making as of last Friday.
Gold /GC
On the weekly charts, an interesting development has appeared… While Gold has shown its relevance in times of risk aversion, particularly with the recent events in Europe, it is building some bearish divergence in the long term weekly charts despite making new highs. The daily charts show clearly that Gold had clocked a parabolic move and duly corrected last week. The indicators suggest a steeper Gold correction to come, bringing prices to 1150 thereabouts.
Crude /CL
Crude had a thrashing week, clearly equilibrating the weekly bearish divergence. On the weekly charts, there appears to have more to come in the next few months. However, the daily charts are starting to signal a probable rally to 75, given the extreme oversold condition of crude. Interestingly, crude closed on Friday with a bullish harami and indicators are showing a possible reversal up.
VIX
The VIX weekly charts show that the increase in volatility is clearly a manifestation of the bullish divergence. It still looks like volatility would be abundant over the next month or so, but a sudden reversal may be in place as the VIX is rather extreme. The daily charts are clearer with a bearish divergence, and a Friday close to form a bearish engulfing. The immediate VIX support at 35, once broken, should see the next support at 25.
SYNOPSIS
From a quick scan of the market based on my usual charts, it is clear to me that the coming week is likely to be very bullish. This is apparently very clear in almost all the charts that had been featured in my WMA. As I began doing this WMA, I was a little wary of my bias, as I had 3 people ask me on Friday itself about the possibility of getting into the market to buy up recently beaten stocks. It appeared that greed has taken the average Joe out there and thus it would be showing up in the charts. Amazingly, it appears to be so.
I am expecting a bullish week. Be it a minor bullish retracement or otherwise, there is one thing that would be clear… it would be volatile.
Note: Any material posted here is of my sole opinion, and my opinion may differ from others. It is definitely NOT a solicitation to do anything else as a consequence of reading this material. The material presented here is intended for educational purposes only.
Thursday, May 20, 2010
Continuing the Downtrend – Market Analysis for 20/05/2010 by Singaporeseeds
Daily charts for S&P futures

S&P kept out of my MOBO bands since breaking out of it on Tuesday. We are continuing this down move to my target at 1080. I do not think the S&P is ready for a down move below the Feb 2010 lows. This will be around 1050. I believe this is just a correction in the big rally from March 2009. We should be making a new irrational high before this rally finally ends.

S&P kept out of my MOBO bands since breaking out of it on Tuesday. We are continuing this down move to my target at 1080. I do not think the S&P is ready for a down move below the Feb 2010 lows. This will be around 1050. I believe this is just a correction in the big rally from March 2009. We should be making a new irrational high before this rally finally ends.
Wednesday, May 19, 2010
CONFIRMATION OF A STRONG DOWNTREND – Market Analysis for 19/05/2010 by Singaporeseeds
Daily charts for Dow

Daily charts for S&P 500

Daily charts for NASDAQ

The indexes moved down as expected and all 3 indexes have broken MOBO support. As long as the indexes do not keep above the lower MOBO band for more than a day, we should see some strong downward momentum over the next few days. My first support for S&P is at the 200 day moving average at around 1110 and then my final support at 1050. I do not think the index should drop lower than that but we shall have to continue to observe the situation. The USD is making some nasty moves that I think should be a precursor for worse things to come.
USD index (UUP)
Daily chart for UUP

As you can see from the daily chart of UUP, USD gapped up and strongly broke fibo XOP resistance. Whenever I see such a strong movement, most often than not, we should see price coming back to test XOP (25.06) again as support before continuing the rally all the way to XXOP at 26.55, which coincidentally was the previous high reached during the panic of October 2008. If this Fibonacci setup on the USD plays out and reaches 26.55, we shall be experiencing a panic within the next 2-3 months.
Natural Gas (UNG)
Daily chart for UNG

UNG tested strong resistance at 7.68 and is currently coming back down. I am expecting UNG to bounce off its 50 day moving average at around 7.36 before turning up to make a high. I believe UNG is in the initial stages of a rally.
Monday, May 17, 2010
Higher Low or Lower Low? – Market Analysis for 17th May 2010 by Singaporeseeds
The markets finally gave way on Friday and made a nice down move. Volatility has been expanding over the past few weeks and I believe we should see such big movements quite frequently over the next few weeks to come.
Daily Chart of the Dow

Daily Charts of the S&P

Daily Charts of NASDAQ

As you can see on the charts, all three indexes failed to break above their respective 50 day moving averages. Now that we have failed the 50, I have 2 more support levels and that’s the MOBO support and the 200 day moving average. All 3 indexes broke MOBO support on Friday but rallied at the last hour to close right above it. A break of this support indicates that there is strong momentum down. I will be looking at this support level closely this week. A break of this level would mean that we may be going down to meet the 200 day moving average at around 10250 for Dow, 1110 for S&P and 2250 for NASDAQ.
Saturday, May 15, 2010
WMA 16 May 2010 - for week ending 21st May 2010 - Decision Point
TIP
For the past month, TIP has been bullish, and the past 2 weeks, it has been divergent from the market. Last week, I noted a correlation trend, and I am wary now, of a potential surging rally to come in time. For now, the TIP weekly still has at least another 2-4 weeks of bullish power left, with a likely correction in between at some point. The daily TIP chart are indicating another week of extreme bullishness. This looks like the beginning of a possible bearish divergence in the daily charts.
JNK/HYG
The coporate junk bonds are just starting a reversal from a bearish divergence in the weekly charts. The daily chart bearish divergence looks like it has equilibrated and is in the midst of a stall. Going down further would mean that the last tanking session is not done, and there is upside risk. Signals are conflicting at this point with candlesticks having long low shadow tails and a gap that was left open all week.
/HG
Copper has been in a downtrend for the past month, and appears to be continuing so as well. The bearish divergence has not equilibrated and there should be more downside to come. The daily charts also indicate a stall in the drop. While more downside seems likely, it looks as if there may be some upside, at least early in the week. The open interest fell 20% over the past 2 weeks, which indicates short covering is in place, and price may spike down with a rally to follow.
It would appear that the Napier leading indicators are showing more downside with a possible reversal up again. The market is spooked but at the same time overcooked for a bear tank. Going down further would be really much worse as there is a lot more downside left open. At this point, a Greek default in the coming days would seal that fate. Otherwise, a change in tone is expected to charge the rally again.
/DX
The USD futures have pretty much gone parabolic with a very strong uptrend clear in the weekly charts. The same chart is indicating a retracement for the next week or two, or at least a stall for this week. Clearly, a Greek default would throw that expectation out the window. The open interest for the USD has been falling 20% in the past 2 weeks, which isn’t good for a strong rally, indicating an underlying weakness. As a matter of fact, the open interest in this USD rally has fallen 64% since its peak. The daily chart is at a decision point. It is near parabolic, and the RSI is at the same level as the last peak. Furthermore, the week closed just at resistance level. This coming week would determine if there is more to go, or a retracement/stall is in place. The USD is gaining basically due to the Euro losing ground.
SPX
Comparing this week to the previous week, this week was a very normal week that ended lower. Although the bearish divergence is starting to equilibrate (meaning go down), I am seeing signs in the weekly charts that there is a lower high to be made. This is supported by the daily chart having completed the equilibration of the bearish divergence. This week is going to be interesting …
Gold /GC
After all the gravity defying gap up rallies… the weekly charts still look bullish, although a retracement is definitely needed. The near parabolic rally is clearly caused by concerns on the Euro, and a flight to “safety” in Gold (and the USD). This retracement that is showing up may go as low as 1170. The daily shart looks starkly different, with an extreme mania in Gold that is about to end, with a long shadow doji on Friday. A close on Monday below 1234 followed by a close below 1210 later would be a clear indication that the gap has closed and a major reversal in place.
Crude /CL
Crude has begun its bearish divergence equilibration on the weekly charts, taking a $14 drop in price over the past 2 weeks. This fall is a little overdone and a bounce is likely to be in place over the next few days, again, barring a Greek default.
VIX
The VIX rose faster than the when LEH filed for Chapter 11. However, the weekly chart paints an ugly picture for the rest of 2010. The daily chart is hinting of a relief from the fear, but the indication is vague at this point.
SYNOPSIS
The overall activity of the market appears to show that the relief bounce is over. I am discounting that for now, preferring to observe. No doubt I still maintain that the market is likely to have topped out for a significant correction, perhaps not before an attempt to fail the top again.
Note: Any material posted here is of my sole opinion, and my opinion may differ from others. It is definitely NOT a solicitation to do anything else as a consequence of reading this material. The material presented here is intended for educational purposes only.
I have an incompleted WMA from last week, which basically saw that this past week was to be a bounce week. I will post it later as an imcompleted record.
Friday, May 14, 2010
Testing Resistance Day 3 – Market Analysis for 14th May 2010 by Singaporeseeds
Daily Charts for S&P

S&P tested resistance at around the 1170 region thrice yesterday the candlestick pattern shows that it had failed to break above the 50 day moving average. Now i'm looking at price not going above 1162 and also convincingly breaking the cyan line (8 day EMA) within the next 2 trading days. Once this happens, it would mean that the market has a bit more to go down.
Natural Gas
Daily charts for Natural Gas ETF UNG

I was alerted of this bullish divergence pattern for UNG. Natural Gas seemed to have bottomed out and had broken above the 50 day moving average yesterday. We may see a test of moving average support again at 4.15 before it gets enough momentum to break above the monthly pivot resistance (red dashed line). I reckoned this one is a big potential bullish move and due to its slow movement and low price, I may purchase the ETF outright.
Wednesday, May 12, 2010
Testing Resistance Day 2 – Market Analysis for 12/05/2010 by Singaporeseeds
That was a big bounce. The bounce over the last 2 days recovered almost 2/3 of the loss since this huge tank happened. Now we are looking at a standard moving average behaviour around the 50 day moving average. Usually when any stock or index makes such a big movement that strongly breaks the 50 day moving average, it will rally back up to the 50 day moving average to test resistance before continuing its downtrend. If it fails to break above the 50 day moving average, it will most likely break the lows of last Thursday. The markets spent the whole of last night testing the 50 day moving average and the monthly pivot resistance. I am expecting the indexes and most of the index stocks to continue to test and then fail to break above these resistances over the next few days. My first support for S&P 500 is at 1050, and the next is at 900.
Daily Charts for S&P 500

Daily Charts for S&P 500

Friday, May 7, 2010
AND IT WENT TO HELL AND BACK! – Market Analysis for 07/05/2010 by Singaporeseeds
Before I post anything I want to quote my market analysis for Thursday.
“Now all 3 indexes are sitting right above the monthly pivot support and are all at the all important 50 day moving average. A bounce at this point will mean either the continuation of the huge March 09 rally or a bounce before going to hell or a decisive break below will mean that erm….that its going to hell.”
It went to hell alright. What a ride!
Last night was one of the most exciting nights for a long time and I was actually in a long position on the market around an hour before the market went to hell and back. The market had been tanking the whole night before this and I thought I had got filled at a good price for my long order. The market went sideways after that. Then for some reason that I wasn’t so sure, I decided to take off all my positions at a small loss and went downstairs to watch tv. I came back around 2.30am for the afternoon scalping window and still did not know what had happened. I thought I had zoomed in the charts too much and that’s why the candles appeared so volatile. It was another 10mins later when I realized that the prices at the side of the charts were “wrong”. It was when I switched to daily charts that I saw the extent of the tank. Called everyone that I know to get up and see the action.
I decided to scalp the market but I forgot that my PT and SL were preset at $50. I went in and got closed out at my PT within 3 secs. Then feeling quite pleased with myself, I adjusted my PT and SL to $100. This time it hit my PT in 10 secs. Then after a few more seconds scalp and countless mins messing around with the super lagging platform, I covered all the losses I made earlier in the day and made another 200 bucks. Decided not to continue to scalp because of the frustrating platform and the effect this frustration is having on my mindset. I closed shop and chatted with my wife for a while before going to sleep.
Daily charts for the Dow

Daily charts for S&P 500

Daily charts for NASDAQ

This is what I call irrational behavior. All 3 indexes broke through most of my moving average supports in one night and bounced off the 200 day moving average. I was very tempted to short the market and hold my position over the next few days but I felt that it should bounce back to test the 50 day moving average. Usually in a downtrend, if price does not bounce when it approaches the 50 day moving average and breaks it decisively, it will bounce afterwards and rally to test resistance at the 50 day moving average before continuing its downtrend. So there’s no need to chase the trend.
From the way the market came back after tanking 1000 points on the Dow, any good non-farm payroll number should rally the market back up to the 50 day moving average. Any bad news and the market will be going back to test yesterday’s low.
Crude Oil
Daily charts for Crude Oil

Crude tanked together with the markets and is at support. It seems that crude oil is moving together with the markets now and it should be bouncing with the markets too. My target for crude is at 70.
Gold
Daily charts for Gold

Gold looks like the only thing that rallied last night. Gold should be rallying over the next few days to 1215. Whether it will break this previous high will depend on its movement over the next few days.
“Now all 3 indexes are sitting right above the monthly pivot support and are all at the all important 50 day moving average. A bounce at this point will mean either the continuation of the huge March 09 rally or a bounce before going to hell or a decisive break below will mean that erm….that its going to hell.”
It went to hell alright. What a ride!
Last night was one of the most exciting nights for a long time and I was actually in a long position on the market around an hour before the market went to hell and back. The market had been tanking the whole night before this and I thought I had got filled at a good price for my long order. The market went sideways after that. Then for some reason that I wasn’t so sure, I decided to take off all my positions at a small loss and went downstairs to watch tv. I came back around 2.30am for the afternoon scalping window and still did not know what had happened. I thought I had zoomed in the charts too much and that’s why the candles appeared so volatile. It was another 10mins later when I realized that the prices at the side of the charts were “wrong”. It was when I switched to daily charts that I saw the extent of the tank. Called everyone that I know to get up and see the action.
I decided to scalp the market but I forgot that my PT and SL were preset at $50. I went in and got closed out at my PT within 3 secs. Then feeling quite pleased with myself, I adjusted my PT and SL to $100. This time it hit my PT in 10 secs. Then after a few more seconds scalp and countless mins messing around with the super lagging platform, I covered all the losses I made earlier in the day and made another 200 bucks. Decided not to continue to scalp because of the frustrating platform and the effect this frustration is having on my mindset. I closed shop and chatted with my wife for a while before going to sleep.
Daily charts for the Dow

Daily charts for S&P 500

Daily charts for NASDAQ

This is what I call irrational behavior. All 3 indexes broke through most of my moving average supports in one night and bounced off the 200 day moving average. I was very tempted to short the market and hold my position over the next few days but I felt that it should bounce back to test the 50 day moving average. Usually in a downtrend, if price does not bounce when it approaches the 50 day moving average and breaks it decisively, it will bounce afterwards and rally to test resistance at the 50 day moving average before continuing its downtrend. So there’s no need to chase the trend.
From the way the market came back after tanking 1000 points on the Dow, any good non-farm payroll number should rally the market back up to the 50 day moving average. Any bad news and the market will be going back to test yesterday’s low.
Crude Oil
Daily charts for Crude Oil

Crude tanked together with the markets and is at support. It seems that crude oil is moving together with the markets now and it should be bouncing with the markets too. My target for crude is at 70.
Gold
Daily charts for Gold
Gold looks like the only thing that rallied last night. Gold should be rallying over the next few days to 1215. Whether it will break this previous high will depend on its movement over the next few days.
Thursday, May 6, 2010
And here we bounce – Market Analysis for 06/05/2010 by Singaporeseeds
The market made a nice correction to the 50 day moving average and seems to have broken it. Now all 3 indexes are sitting right above the monthly pivot support and are all at the all important 50 day moving average. A bounce at this point will mean either the continuation of the huge March 09 rally or a bounce before going to hell or a decisive break below will mean that erm….that its going to hell.
I will stick with the indexes making a bounce over the next 1-2 days to resistance level at around 1181 for the S&P before continuing to make its way down to the next strong support at 1150. However as the non farm payroll is just tomorrow, I believe this report will be an important factor in the movement of the indexes. I will be keeping my positions light until after the report is out.
I will stick with the indexes making a bounce over the next 1-2 days to resistance level at around 1181 for the S&P before continuing to make its way down to the next strong support at 1150. However as the non farm payroll is just tomorrow, I believe this report will be an important factor in the movement of the indexes. I will be keeping my positions light until after the report is out.
Trend change in S&P500... 6 May 2010

Uploaded with ImageShack.us
Based on Price Action Trend change bias, the top pattern has been established on the SPX hourly charts, indicating a significant correction is in place. This with bearish divergence in the daily and weekly charts, as well as the previously overbought indicators of almost any type, and the Sell in May adage... we are in for a significant correction in the weeks to come. Thereafter, the bull rally is likely to continue.
Monday, May 3, 2010
Top of the world - WMA 3 May 2010
TIP
Had a very bullish week. It broke a price action pattern and made dizzying highs. The MACD bullish divergence did happen and the TIPs look a little overbought, but still bullish. Weekly charts have at least another week of bullishness, although the daily charts are a overdone, indicating a short term pullback early in the week.
JNK
The coporate junk bonds did complete the 2 weeks of bullish up- close for the weekly charts and it is about ready for a correction based on bearish divergences. Similarly, the indicators for the daily charts are telling of a likely reversal with weak higher highs over the past week. The MACDH is getting a little messy and it may be the week of discernment for this.
HYG looks similar as well.
/HG
Copper did get a bashing week with a major reversal in prices. On the weekly, the bearish divergence looks yummy and already gaining momentum to equilibrate. The daily prices are a little extreme and should see a stall and more downside in the coming weeks. The open interest indicates a lot of shorting activity for copper… this does not bode well for the metal price although it has hit a support level.
I concluded a in my last analysis that according to the leading indicators (Napier’s), there seems to be indications that the market is toppy. Both JNK and especially HG already started the downleg and evening out the divergence. Furthermore, we had a weak spike that formed a lower high (LH) this week. I am a little miffed by the extreme TIP bullishness… and I do wonder has this anything to do inflation. With 2 out of three of the Napier’s leading indicators going bear, and TIP being bullish, I would wait to see if TIP can break and stay above 106.38, which I do not expect so at this point. Once TIP reverses, all the leading indicators should be telling us a very coherent picture.
/DX
The USD is gained ground basically due to the Euro losing ground. This affected Crude and other commodities, but surprisingly, not Gold. Something is up there… For the USD, it is due for a correction in the early part of this week, and should gain more ground later in the week. For this to happen, the Euro should be heading up with news that Greece is “stabilizing” by accepting the bailout package just on Sunday. An attempt was made to breakthough 82.06, but that proved to be a good resistance level. The USD should revisit the 81.40 support this week.
SPX
Over the last two weeks, there was the expected weak spike up, and then the past week was a very interesting week. It began with a high of 1219.8 and then fell 25 points the next day. This was followed by a recovery of at least 20 points over the next two days and Friday was a reversal of that, losing 20 points again. This is a top forming pattern. Weekly and daily charts are indicating the equilibration of the bearish divergence is in place.
2 weeks ago, I posted” The daily charts are just about ready to have a mild correction (expect 1160-1180) but I am expecting a lower high to form, perhaps the week after, with a small rally after the coming week’s correction only to fail at 1210.”
We got that alright… and moving forward, it should break past 1180 and end up much lower. Today’s news is showing a line-up of news that should just about ”align the stars”. Over the weekend, China increased the RRR of the banks further, and Asian markets reacted rather badly. Greece accepted the aid package and in response, the European markets did not view it with any good outcome nonetheless. That’s the news and global market reactions. Last Friday, the SPX posted a bearish engulfing pattern establishing a lower high on the daily charts. This has a couple of implications… that the next 2-3 days should see a follow through of down days, and if so, it would
Gold /GC
The weekly charts appear much more bullish than 2 weeks ago. And much more so for the next month at least, looking for 1350. The daily chart previously appeared to be bearish, but it just bounced off support and started taking off, making a bullish rally in Gold. Perhaps Greece and Euro paranoia accentuated Gold’s climb, and it is starting to be a little overbought in the daily charts. The open interest on Gold shows that there is inflow of money into gold. I would be bullish on Gold for the next two weeks or so, but I am expecting near term resistance at 1185, before a target of 1214 is achieved. The main strength in Gold is visual with rising Gold prices in the face of a rising USD (of which the USD is rising due to falling Euro).
Crude /CL
Crude did close way below 83, but bounced back up above 85. The correction appears to be completed and it is back to being overbought in the daily charts. The weekly charts indicate that there is still an uptrend, and appears to have a spike in crude prices for this week.
VIX
The VIX weekly charts are really showing that it is time for volatility to increase. The daily VIX charts are way off into the upper extremes and it can remain there for some time, although over the next week, it should moderate lower slightly before another rally. We should see more volatility in the weeks to come as well as this being one of the stars to align for a market reversal.
SYNOPSIS
I posted this the last time I did the WMA 2 weeks ago…” I am still expecting a small relief rally which should fail the last high, and this needs another 2-3 more shocking events (including the PIIGS which have been sidelined since mid last week).
Last week was the turnaround, and the coming week will seal it if it is to happen.”
Clearly, it happened. From many perspectives, this looks like a highly probably top. On the SPX there is a head & shoulders pattern, with a bearish engulfing on the weekly charts, while the oscillators are showing bearish divergences and are in the overbought territory. The VIX is supported nicely and has bullish divergence closing. The Euro is in trouble and China is restraining. Gold is also starting its rally, while crude is deciding. The Napier’s leading indicators are mostly leading bearish with TIPS making a beeline the opposite way. Once this turns around, it will get ugly.
Furthermore, it is May 2010. Early this year, every analyst decided that 1H10 would be bullish with 2H10 having downside correction. May holds the adage of “sell in May and go away”. Almost all the indicators/oscillators are in the overbought region, or just exiting it. Greece has a dateline (deadline) mid May for the EU/IMF funds to flow in, while we have not even seen/heard/read of anything really concrete to start the process of actually aiding Greece. This IMHO, is reminiscent of Lehman Bros pre-trigger in 2008. Whether or not this alignment of the stars actually starts the snowball rolling, remains to be seen… but in terms of probability, I know where I am.
Note: Any material posted here is of my sole opinion, and my opinion may differ from others. It is definitely NOT a solicitation to do anything else as a consequence of reading this material. The material presented here is intended for educational purposes only.
Sunday, May 2, 2010
And the tank continues – Market Analysis for 03/05/2010 by Singaporeseeds
Weekly chart for Dow

Daily chart for Dow

Weekly chart for S&P 500

Daily chart for S&P 500

On weekly charts, both S&P 500 and Dow hit the 200 week moving average and failed to break above. On daily, both made a lower high.
I believe we had already began the long awaited correction. I believe we will be making new highs after this correction but we would have to continue to monitor the situation. On the S&P, my first support would be at the 50 day moving average at around 1165 and the next support would be at the January highs of 1143.
Gold
Daily chart for Gold

Gold seems to have found support and is poised to break it’s previous high of 1215. From December 2009 till now, it has formed a inverted head and shoulders pattern and has bounced off the head and shoulders support at 1130 around mid April 2010. Gold should be breaking up to around 1230 in the next few weeks.
Crude Oil
Daily chart for Crude Oil

Crude bounced off support at 82.50 a few days ago. I do not think that it will be making new highs but I’m getting some signals that are showing otherwise. I will be looking closely at crude over the next few days.
Subscribe to:
Posts (Atom)