Daily chart for S&P
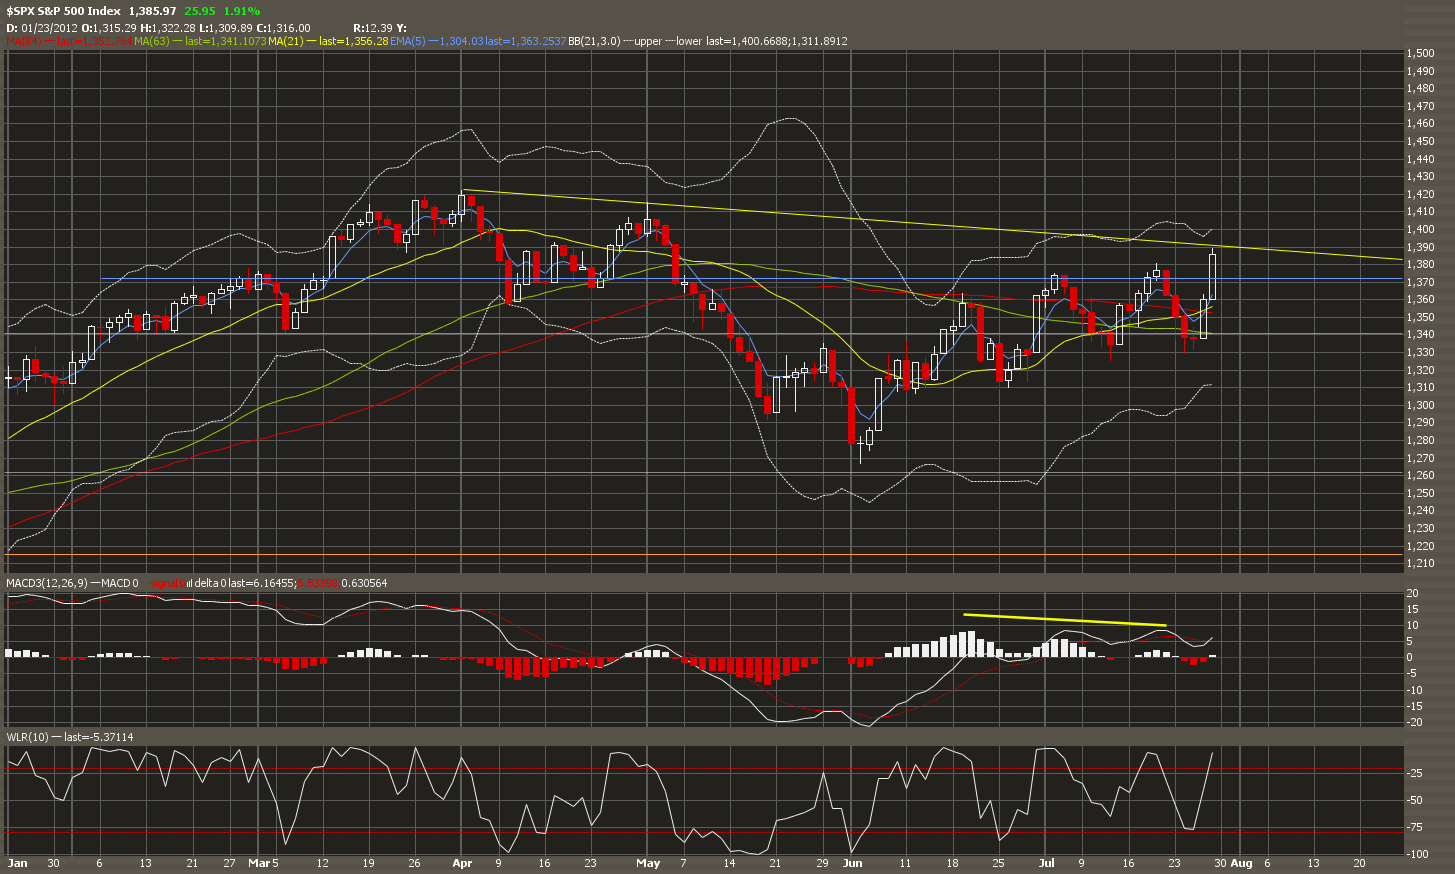
As I’ve mentioned in my previous post, the start of the
downtrend will be when the MACD Histogram turns red. It looked like so until
last Thursday when we moved higher on very light volume hence a lonely new high supported
only by a few players. We are 2 days left before
the end of the trading month and it is still green so I suppose this is not the
time yet. In fact, it looks like we are going to make a new high for the year.
From what I see on my charts, as long as we stay above
support at 1366, we will remain bullish. First support at 1366, then 1310.
Daily chart for the Dollar

The Dollar (UUP) failed to break resistance at 83.7 and made
a failure movement. If it ends down on Monday, it will confirm the downtrend.
First support at 81.6, then 79.
Daily chart for Gold

Gold broke the wedge that it had been in since December
2011. This is the start of the next leg up for gold. We might dip a bit over
the next few days but we should see gold (GLD) rally over the next few weeks.
Support at 156.73. Resistance at 164.5 and 174.
Daily chart for Crude Oil

Crude Oil (USO) just made a bullish set up. Confirmation
will be when it breaks about the 50 day moving average at around 34.6. Before
that happens, it is still technically bearish.
No comments:
Post a Comment